We help you understand what the numbers mean, without needing industry knowledge of knowing technical terms. Our performance reports are clear, insightful, and built to guide better decisions.
Clear Reports
Simple English
Visuals & Charts
Easy to Understand
Better Insights = Better Decisions
We make your numbers make sense, even a primary school kid could understand them.
UNDERSTAND AT A GLANCE
What We Cover In Our Reports
01
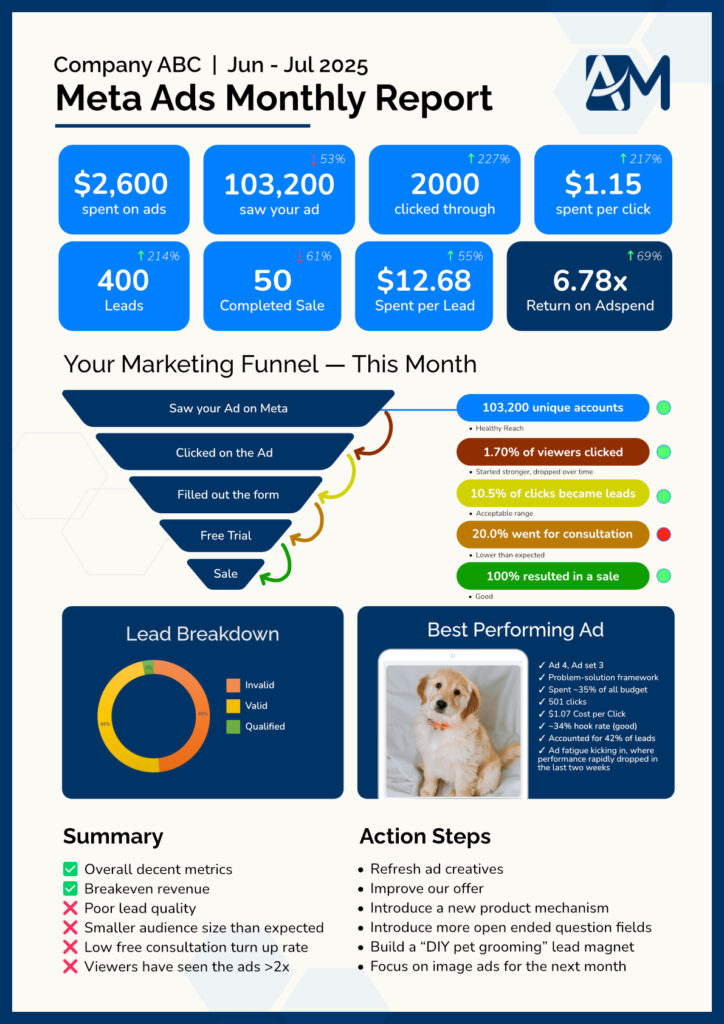
General Metrics
Amount spent, reach, click thru rate, cost per click, leads, sales, cost per lead, ROAS etc.
02
Funnel Analysis
Visual of the funnel, with drop-off rates and percentage comparison with target metrics
03
Lead Breakdown
Breakdown of invalid, valid, and qualified leads, with analysis of the best performing ad
04
Summary
Custom campaign score, summary of pros and cons of the month, as well as action steps
Sample Campaign Report
Note: Only a sample is provided as actual campaign data is confidential. Dummy numbers are used in the sample, and may not make sense. This sample is for a lead generation business, a similar report is done for e-commerce businesses.